Tuesday 30 August 2016

New House Building in Mid Sussex increased by 2.27% in the last year.


Let me speak frankly, even with Brexit and the fact immigration numbers will now be reduced in the coming years, there is an unending and severe shortage of new housing being built in the Mid Sussex area (and the UK as a whole).  Even if there are short term confidence trembles fueled by newspapers hungry for bad news, the ever growing population of Mid Sussex with its high demand for property versus curtailed supply of properties being built, this imbalance of supply/demand and the possibility of even lower interest rates will underpin the property market.

When the Tories were elected in 2015, Mr. Cameron vowed to build 1,000,000 new homes by 2020.  If we as a Country hit those levels of building, most academics stated the UK Housing market would balance itself as the increased supply of property would give a chance for the younger generation to buy their own home as opposed to rent.  However, the up-to-date building figures show that in the first three months of 2016 building starts were down.  Nationally, there were 35,530 house building starts in the first quarter, a long way off the 50,000 a quarter required to hit those ambitious targets.

Looking closer to home, over the last 12 months, new building in the Mid Sussex District Council area has grown.  In 2014/15, for every one thousand existing households in the area, an additional 10.11 homes were built.  For 2015/16, that figure is now 10.34 homes built per thousand existing households.  Nationally, to meet that 1,000,000 new homes target, we need to be at 7.12 new homes per thousand, which means Mid Sussex District Council is actually above the National target, the problem is the country is only building at a rate of 4.9 for every thousand exiting households – we can’t just rely on the Mid Sussex District Council to build for the rest of the Country.


To put those numbers into real chimney pots, over the last 12 months, in the Mid Sussex District Council area,
        620 Private Builders (e.g. New Homes Builders)
        50 Housing Association
        Nil Local Authority

I am of the opinion Messer’s Cameron and Osborne focused their attention too much on the demand side of the housing equation, using the Help to Buy scheme and low 
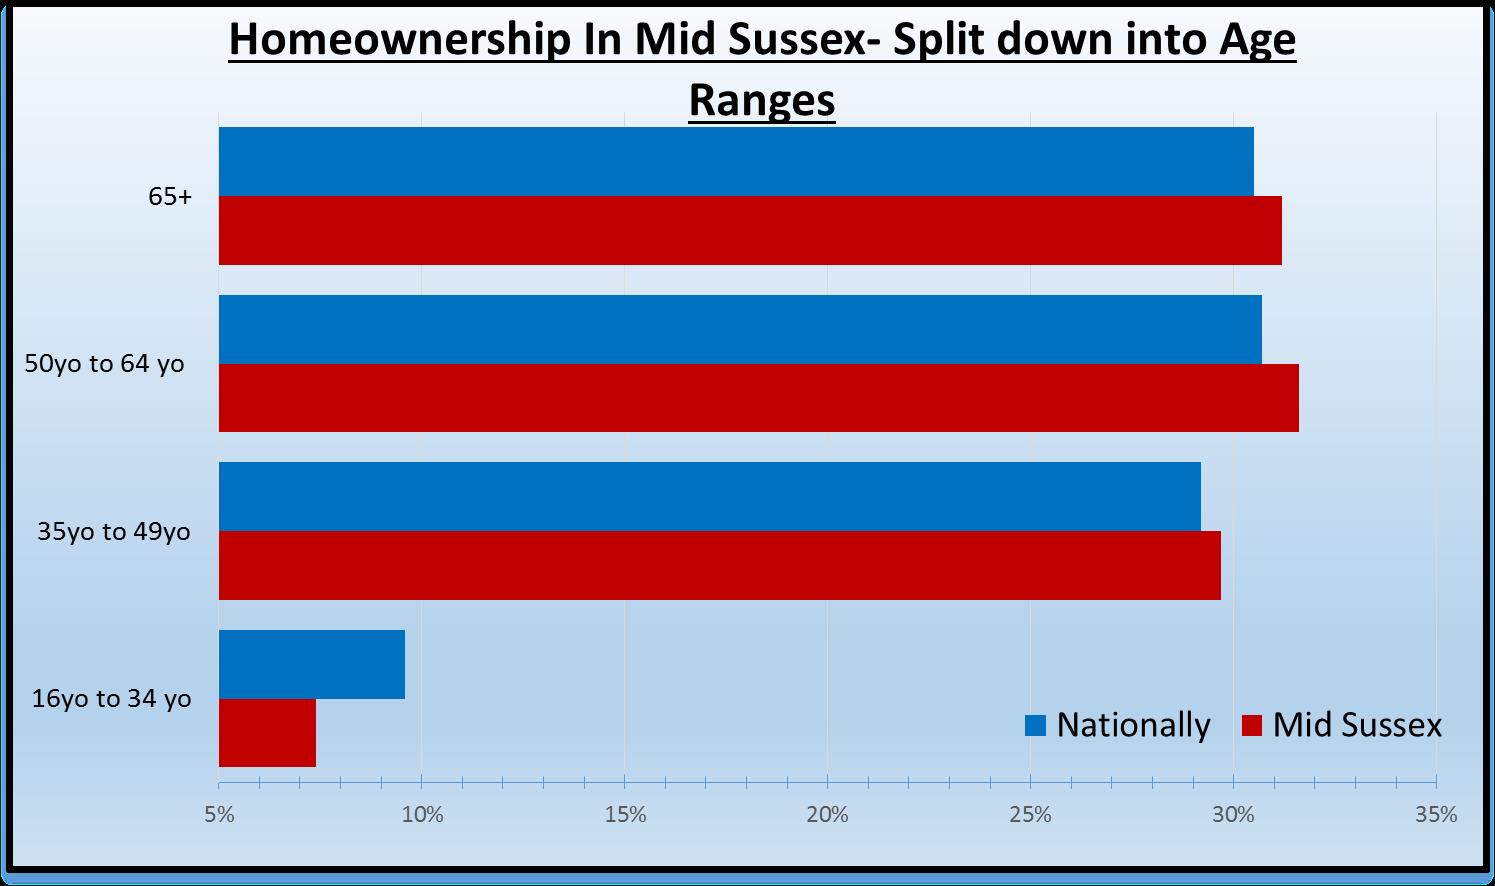
deposit mortgages to convert the ‘Generation Rent’ i.e. Burgess Hill ‘20 somethings’ who are set to rent for the rest of their lives to ‘Generation Buy’.  On the other side of the coin, I would strongly recommend the new Housing Minster, Gavin Barwell, should concentrate the Government’s efforts on the supply side of the equation.  There needs to be transformations to planning laws, massive scale releases of public land and more investment, as more inventive solutions are needed.

However, ultimately, responsibility has to rest on the shoulders of Theresa May.  Whilst our new PM has many plates to spin, evading on the housing crisis will only come at greater cost later on.  What a legacy it would be if it was Mrs. May who finally got to grips with the persistent and enduring shortage of homes to live in.  The PM has already referenced the ‘need to do far more to get more houses built’ and stop the decline of home ownership.  However, she has also ruled out any changes to the green belt policy – something I will talk about in a future up and coming article.  Hopefully these statistics will raise the alarm bells again and persuade both residents and Councillor’s in the Mid Sussex District Council area that housing needs to be higher on its agenda.

Tuesday 23 August 2016

Post Brexit – Mid Sussex Property Prices set to drop £35,000 in the next 12 months?


Even the sanest person in Britain has to admit the Brexit vote will, in one shape or another, affect the UK Property market. Excluding central London which is another world, most commentators according to Denton House Research are saying prices will be affected by around 10%. So looking at the commentators’ thoughts in more detail, property values in Mid Sussex will be 10% lower than they would have been if we hadn’t voted to leave the EU. 

As the average value of a property in the Mid Sussex District Council area is £350,100, this means property values are set to drop for the average Mid Sussex property by £35,010. Batten down the hatches, soup kitchens and mega recession here we come. It’s going to get rough.

But before we all go into panic mode across Mid Sussex, the devil is always in the detail.
Look at the phrase again, and I have highlighted the relevant part “Property values in Mid Sussex will be 10% lower than they would have been if we hadn’t voted to leave the EU”.

Property values today, according to the Land Registry are 14.45% higher than a year ago in the Mid Sussex District Council area. The 12 months before that they rose by 6.75% and the 12 months before that, they rose by 8.3%. If we hadn’t voted to leave, I believe on these figures, we could have safely assumed Mid Sussex house prices would have been 12% higher by the summer of 2017.

That’s the point, we won’t see a house price crash across Mid Sussex it’s just that house prices in a year’s time will only be 2% higher than they are now (i.e. 12% less the 10% lower figure because of Brexit). Let’s look at the historic figures and how that compares to today’s figures for the Mid Sussex District Council area as a whole.

Average Value of a property 20 years ago             £ 74,600
Average Value of a property 10 years ago             £238,500
Average Value of a property 2 years ago               £286,600
Average Value of a property 1 year ago                £305,900
Average Value of a property today                       £350,100
Projected Value of a property in 12 months’ time £357,100


Therefore, I believe the average value of a Mid Sussex property will be £7,000 higher in 12 months’ time than today.

That’s not to say Mid Sussex property prices might not dip slightly in the run up to Christmas, in fact they always have done just about every year since the year 2000 and most of those were boom years. In 12 months’ time this is my considered opinion of where Mid Sussex property values will be and looking at the historic prices, even if I (and many other property market commentators) are wrong and they drop 10% from today’s figure, in the whole scheme of things, we have been through a Credit Crunch, Black Monday and 15% interest rates over the last 20 to 30 years, and still Mid Sussex house prices have always bounced back.

Whilst the UK's vote for Brexit has created an uncertainty in the Mid Sussex housing market, there is no need to panic and prospective buyers should merely use common sense about their purchases. I always say to people to be prudent and if you are taking out a mortgage, at some stage during the life of that mortgage, circumstances will be difficult. We won’t have a 2008 Credit crunch fire sale of properties because after the Mortgage Market Review which took place in the spring of 2013, mortgage borrowers are not as highly leveraged this time around.  As a result of this, with any luck there will not be too many distressed sales, which cause widespread price reductions.

So what of Mid Sussex landlords? They have recently been thrashed by Osborne’s tax changes, but yields could rise if Mid Sussex house prices fall/stablise and rents grow, and this might also make it easier to obtain mortgages, as the income would cover more of the interest cost. If prices were to level or come down that could help Mid Sussex landlords add to their portfolio, as rental demand for  property is expected to stay strong as more people find it more and more difficult to obtain mortgages.

Tuesday 16 August 2016

The Burgess Hill Love Affair with its 2,900 Terraced Houses.


Call me old fashioned, but I do like the terraced house. In fact, I have done some research that I hope you will find of interest my Mid Sussex property market blog reading friends!

In architecture terms, a terraced or townhouse is a style of housing in use since the late 1600’s in the UK, where a row of symmetrical / identical houses share their side walls. The first terraced houses were actually built by a French man, Monsieur Barbon around St. Paul’s Cathedral within the rebuilding process after the Great Fire of London in 1666.  Interestingly, it was the French that invented the terraced house around 1610-15 in the Le Marais district of Paris with its planned squares and properties with identical facades. However, it was the 1730’s in the UK, that the terraced/townhouse came into its own in London and of course in Bath with the impressive Royal Crescent.

However, we are in Burgess Hill, not Bath, so the majority of our Burgess Hill terraced houses were built in the Victorian era.  Built on the back of the Industrial Revolution, with people flooding into the towns and cities for work in Victorian times, the terraced house offered decent livable accommodation away from the slums. An interesting fact is that the majority of Victorian Burgess Hill terraced houses are based on standard design of a ‘posh’ front room, a back room (where the family lived day to day) and scullery off that.  Off the scullery, a door to a rear yard, whilst upstairs, three bedrooms (the third straight off the second).  Interestingly, the law was changed in 1875 with the Public Health Act and each house had to have 108ft of livable space per main room, running water, its own outside toilet and rear access to allow the toilet waste to be collected (they didn’t have public sewers in those days in Burgess Hill – well not at least where these ‘workers’ terraced houses were built).

It was the 1960’s and 70’s where inside toilets and bathrooms were installed (often in that third bedroom or an extension off the scullery) and gas central heating in the 1980’s and replacement UPVC double glazing ever since.

Looking at the make-up of all the properties in Burgess Hill, some very interesting numbers appear.  Of the 12,602 properties in Burgess Hill;

3,694 are Detached properties (29.3%)
4,269 are Semi Detached properties (33.8%)
2,920 are Terraced / Town House properties (23.1%)
1,708 are Apartment/ Flat’s (13.5%)


And quite noteworthy, there are 11 mobile homes, representing 0.09% of all property in Burgess Hill. 

When it comes to values, the average price paid for a Burgess Hill terraced house in 1995 was £59,550 and the latest set of figures released by the land Registry states that today that figure stands at £249,370, a rise of 319% - that’s not bad at all is it. When you consider apartments in Burgess Hill in the same time frame have only risen by 261%.

But then a lot of buy to let landlords and first time buyers I speak to think the Victorian terraced house is expensive to maintain.  I recently read a report from English Heritage that stated maintaining a typical Victorian terraced house over thirty years is around sixty percent cheaper than building and maintaining a modern house- which is quite fascinating don’t you think!

Tuesday 9 August 2016

92.5% of Mid Sussex Homeowners are over 35. The affect of their Brexit vote on the Mid Sussex Property Market.


Well it’s been nearly 7 weeks since the Referendum vote and we have had a chance to reflect on the momentous decision that the British public took. Many of you read the article I wrote on the morning of the results. I had gone to bed the night before with a draft of my Remain article nicely all but finished, to be presented, at just after 5am, with the declaration by the BBC saying we were leaving the EU. I don’t think any of us were expecting that.

If you want to read a copy of that original Post Brexit blog post just scroll back to late June to find it. In this article I would like to take my thoughts on from that initial article and now start to see the clearer picture as the dust settles on the UK, but more importantly, the Mid Sussex Property Market.

In case you weren’t aware, the residents of the Mid Sussex District Council area went against the National mood and voted as follows;

Mid Sussex District Council Remain Votes 46,471 (53.1% of the vote)
Mid Sussex District Council Leave Votes 41,057 (46.9% of the vote)

Mid Sussex District Council Turnout; 80.7%

I have been reading there is some evidence to indicate younger voters were vastly more likely to vote remain than their parents and grandparents. Whilst the polling industry's techniques may have been widely criticised, following them getting both the 2010 General Election and the recent Brexit vote wrong, anecdotally, many surveys seem to suggest there was a relationship between age and likelihood to support leaving the EU.

Interestingly, the average age of a Mid Sussex resident is 41 years old, which is above the national average of 39.3, which might go some way to back up the way Mid Sussex voted? What I do know is that putting aside whether you were a remain or leave voter, the vote to leave has, and will, create uncertainty and the last thing the British property market needs is uncertainty (because as with previous episodes of uncertainty in the UK economy – UK house prices have tended to go down).

Interestingly, when we look at the home-ownership rates in the Mid Sussex District Council area, of the 43,219 properties that are owned in the Mid Sussex District Council area (Owned being owned outright, owned with a mortgage or shared ownership), the age range paints a noteworthy picture.

   Age 16 to 34 homeowners 3,215 or 7.4% (Nationally 9.6%)
Age 35 to 49 homeowners 12,833 or 29.7%   (Nationally 29.2%)
Age 50 to 64 homeowners 13,679 or 31.6%   (Nationally 30.7%)
             Aged 65+ homeowners 13,492 or 31.2% (Nationally 30.5%)


So, looking at these figures and the high proportion of older homeowners, you might think all the Mid Sussex District Council area homeowners would vote Remain to keep house prices stable and younger people would vote out so house prices come down- so they could afford to buy.

But there's a risk in oversimplifying this. The sample of the polling firms are in the thousands whilst the country voted in its millions. Other demographic influences have been at play in the way people voted, as early evidence is starting to suggest that class, level of education, the levels of immigration and ethnic diversity had an influence on the way the various parts of the UK voted.

So what I suggest is this – Don’t assume everyone over the age of 50 voted ‘Leave’ and don’t assume most 20 somethings backed ‘Remain’; because many didn't!